Picture 1 of 1

Stock photo

Picture 1 of 1

Stock photo

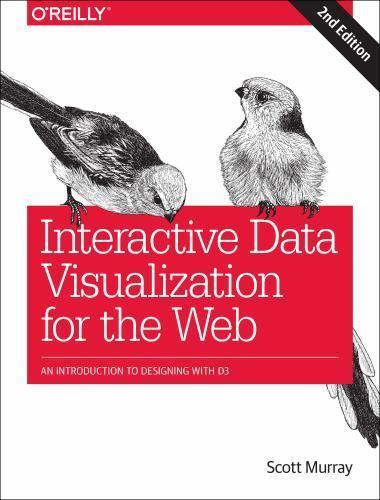
Interactive Data Visualization for the Web : An Introduction to Designing with D3 by Scott Murray (2017, Trade Paperback)
F
FashionEmoire99 (381)
100% positive feedback
Price:
$22.81
+ $3.99 shipping
Returns:
14 days returns. Buyer pays for return shipping. If you use an eBay shipping label, it will be deducted from your refund amount.
Condition:
Sku: 39214Gift-GG. Condition: New. Qty Available: 1.
Oops! Looks like we're having trouble connecting to our server.
Refresh your browser window to try again.
About this product
Product Identifiers
PublisherO'reilly Media, Incorporated
ISBN-101491921285
ISBN-139781491921289
eBay Product ID (ePID)221462115
Product Key Features
Number of Pages458 Pages
LanguageEnglish
Publication NameInteractive Data Visualization for the Web : an Introduction to Designing with D3
Publication Year2017
SubjectProgramming / General, Web / Web Programming, Programming / Open Source, Data Visualization
TypeTextbook
AuthorScott Murray
Subject AreaComputers
FormatTrade Paperback
Dimensions
Item Height1.1 in
Item Weight29 Oz
Item Length9.2 in
Item Width7 in
Additional Product Features
Edition Number2
Intended AudienceScholarly & Professional
LCCN2018-302151
Dewey Edition23
IllustratedYes
Dewey Decimal005.13/3
SynopsisCreate and publish your own interactive data visualization projects on the web--even if you have little or no experience with data visualization or web development. It's inspiring and fun with this friendly, accessible, and practical hands-on introduction. This fully updated and expanded second edition takes you through the fundamental concepts and methods of D3, the most powerful JavaScript library for expressing data visually in a web browser. Ideal for designers with no coding experience, reporters exploring data journalism, and anyone who wants to visualize and share data, this step-by-step guide will also help you expand your web programming skills by teaching you the basics of HTML, CSS, JavaScript, and SVG. Learn D3 4.x--the latest D3 version--with downloadable code and over 140 examples Create bar charts, scatter plots, pie charts, stacked bar charts, and force-directed graphs Use smooth, animated transitions to show changes in your data Introduce interactivity to help users explore your data Create custom geographic maps with panning, zooming, labels, and tooltips Walk through the creation of a complete visualization project, from start to finish Explore inspiring case studies with nine accomplished designers talking about their D3-based projects, Create and publish your own interactive data visualization projects on the web'??even if you have little or no experience with data visualization or web development. It'??s inspiring and fun with this friendly, accessible, and practical hands-on introduction. This fully updated and expanded second edition takes you through the fundamental concepts and methods of D3, the most powerful JavaScript library for expressing data visually in a web browser. Ideal for designers with no coding experience, reporters exploring data journalism, and anyone who wants to visualize and share data, this step-by-step guide will also help you expand your web programming skills by teaching you the basics of HTML, CSS, JavaScript, and SVG. Learn D3 4.x'??the latest D3 version'??with downloadable code and over 140 examples Create bar charts, scatter plots, pie charts, stacked bar charts, and force-directed graphs Use smooth, animated transitions to show changes in your data Introduce interactivity to help users explore your data Create custom geographic maps with panning, zooming, labels, and tooltips Walk through the creation of a complete visualization project, from start to finish Explore inspiring case studies with nine accomplished designers talking about their D3-based projects
LC Classification NumberQA76.73.J38M87 2017
All listings for this product
Ratings and Reviews
Most relevant reviews
- Aug 07, 2023
Great IT source!
Very helpful for improving working skills with data.Verified purchase: YesCondition: Pre-owned


