Picture 1 of 5

Stock photo


Picture 1 of 5
Stock photo
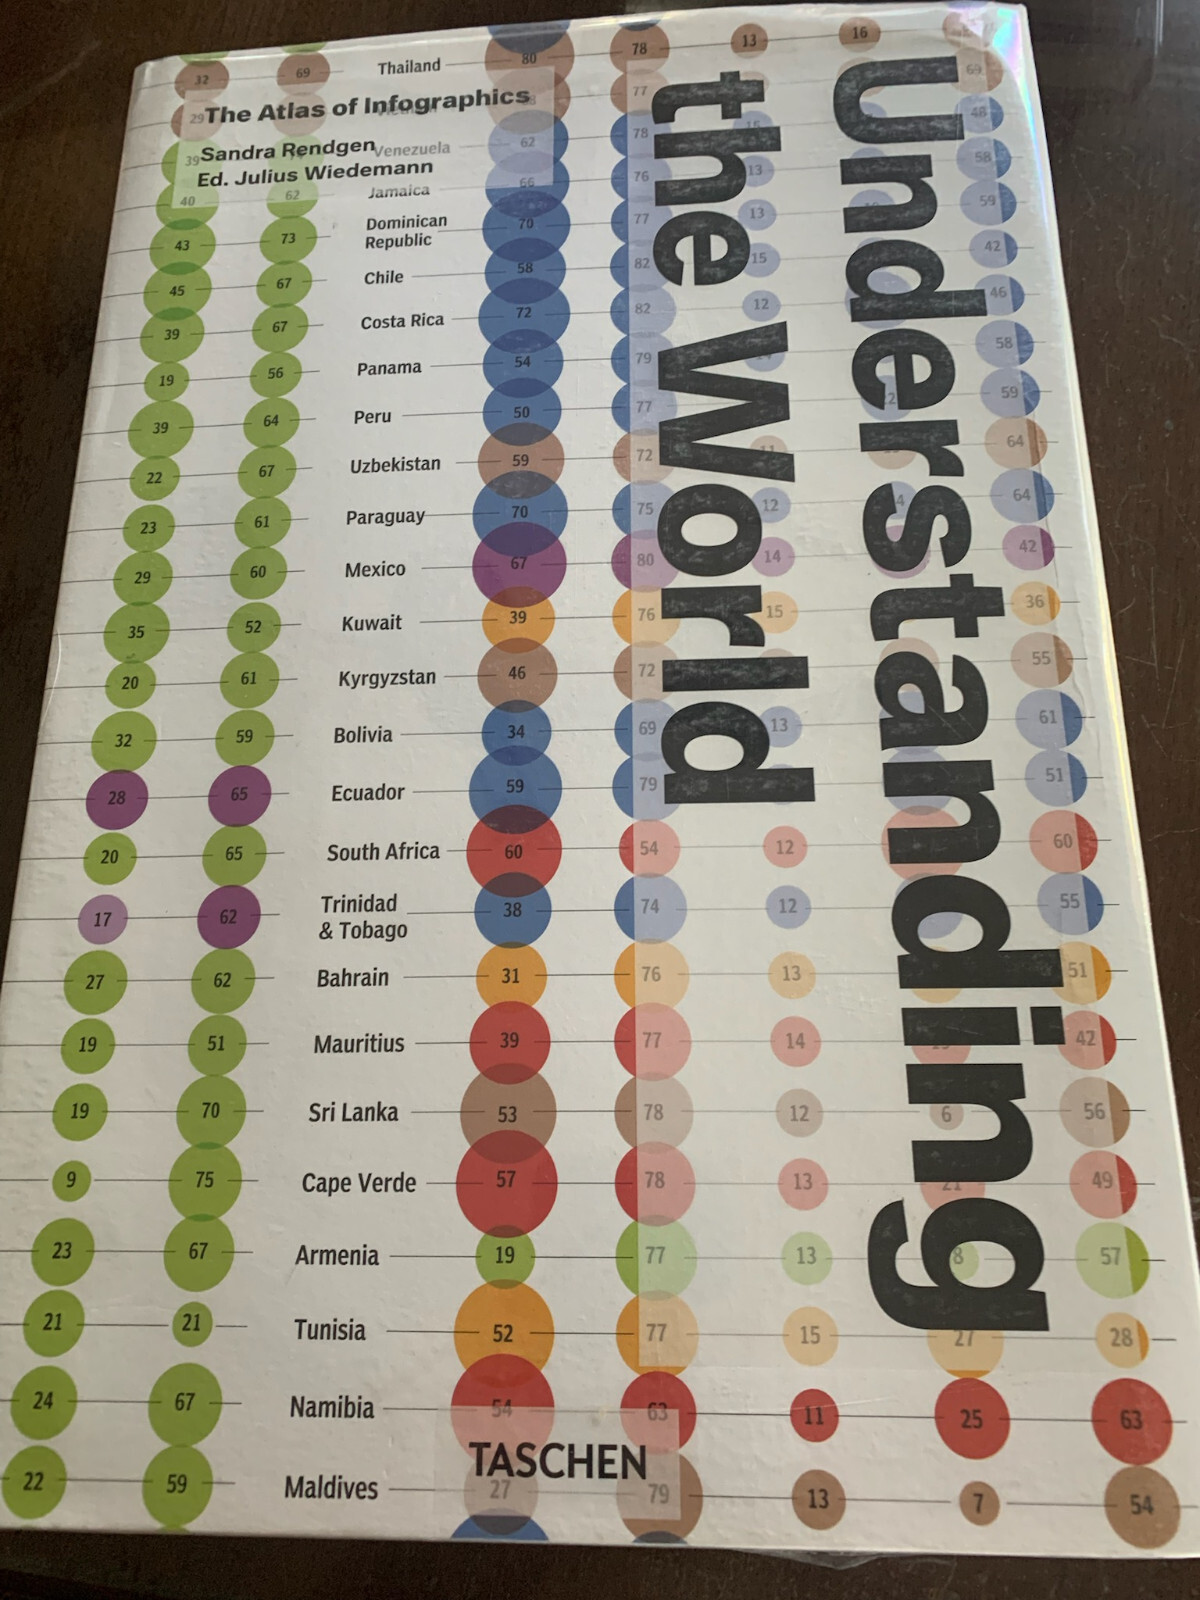


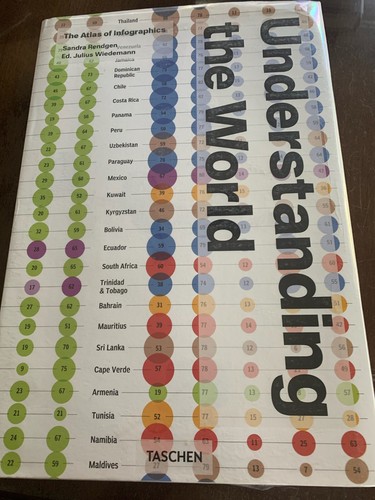
Understanding the World. the Atlas of Infographics by Sandra Rendgen (2014, Hardcover)

Wallen Sells Books (183)
100% positive feedback
Price:
$30.15
+ $9.13 shipping
Returns:
Condition:
This hardcover book titled "Understanding the World. The Atlas of Infographics" by Sandra Rendgen is a must-have for any design enthusiast. With 456 pages filled with stunning illustrations and informative content, this book offers a comprehensive overview of graphic arts and illustration. The book measures 14.7 inches in length, 10 inches in width, and 1.9 inches in height, and weighs 132.1 ounces. It was published in 2014 by Taschen and is written in English. The book covers topics such as graphic arts/illustration and graphic arts/general. With its easy-to-understand language and beautiful visuals, this book is perfect for anyone interested in the world of design.
- Buy It NowUnderstanding the World. The Atlas of Infographics 2014 Sandra Rendgen TASCHEN
Oops! Looks like we're having trouble connecting to our server.
Refresh your browser window to try again.
About this product
Product Identifiers
PublisherTaschen
ISBN-103836548836
ISBN-139783836548830
eBay Product ID (ePID)201620882
Product Key Features
Book TitleUnderstanding the World. the Atlas of Infographics
Number of Pages456 Pages
LanguageEnglish
Publication Year2014
TopicGraphic Arts / Illustration, Graphic Arts / General
IllustratorYes
GenreDesign
AuthorSandra Rendgen
FormatHardcover
Dimensions
Item Height1.9 in
Item Weight132.1 Oz
Item Length14.7 in
Item Width10 in
Additional Product Features
Intended AudienceTrade
Reviews...a fascinating read, and regardless of the depth of your current knowledge about the world, it is guaranteed to teach you something new., ...some of the best infographics from around the world... Understanding the World is fascinating to flick through and, with its lovely production values, would look good on any coffee table., ... 280 information-rich graphics, ranging from the environment and technology to the economics and culture of the 21st century. A highly recommended book for any household., "...an incredible insight into the world we live in. They say a picture says a thousand words, well I think INFOGRAPHICS can say a million. A breathtaking look at the scale, diversity and detail in every element of life on Earth, the book opens your eyes to new facts and captivates your imagination. With graphics drawn from such sources as Fortune, National Geographic, and The Guardian, this is not only a showcase of outstanding data design, but also a fascinating digest of where and how we live." The Birmingham Gazette, Birmingham, Understanding the World: The Atlas of Infographics is an attempt to decode a planet drowned in enigmatic information and statistics... An important record of the state of the world today., "Two hundred eighty graphics focusing on the 21st century provide accessible, visual ways of explaining the world through captivating information graphics and design".
Dewey Edition23
Dewey Decimal902.22
Edition DescriptionMultilanguage edition
SynopsisThis expansive publication follows up on TASCHEN's Information Graphics with more than 280 contemporary and vintage visualizations to help us understand our world, including seven fold-out spreads. Spanning the present state, and historical shaping, of society, culture, technology, economics and the environment, this is at once a showcase of the most outstanding data design work, and a fascinating digest of where and how we live., Dazzling in scale, diversity and detail, the world never ceases to open our eyes and captivate our curiosity. Ever since the earliest cave paintings, humans have looked at this Earth that is our home and endeavored to understand it. This expansive visual atlas presents the most exciting, creative and inspiring ways of explaining the world in information graphics. Divided into five chapters, the book covers the environment, technology, economics, society, and culture to reveal some of the Earth's greatest intricacies in accessible visual form. Featuring more than 280 graphics, reproduced in large scale including seven fold-out spreads, the collection focuses on the 21st century, but also includes historical masterpieces to put our current situation into perspective.Nigel Holmes introduces the book with an exclusive infographic of his own, while Sandra Rendgen provides an illustrated historical essay to explore how we have studied and interpreted our world over the centuries. With graphics drawn from such sources as Fortune, National Geographic, and The Guardian, this is not only a showcase of outstanding data design, but also a fascinating digest of where and how we live., Dazzling in scale, diversity and detail, the world never ceases to open our eyes and captivate our curiosity. Ever since the earliest cave paintings, humans have looked at this Earth that is our home and endeavored to understand it.This expansive visual atlas presents the most exciting, creative and inspiring ways of explaining the world in information graphics. Divided into five chapters, the book covers the environment, technology, economics, society, and culture to reveal some of the Earth's greatest intricacies in accessible visual form. Featuring more than 280 graphics, reproduced in large scale including seven fold-out spreads, the collection focuses on the 21st century, but also includes historical masterpieces to put our current situation into perspective.Nigel Holmes introduces the book with an exclusive infographic of his own, while Sandra Rendgen provides an illustrated historical essay to explore how we have studied and interpreted our world over the centuries. With graphics drawn from such sources as Fortune, National Geographic, and The Guardian, this is not only a showcase of outstanding data design, but also a fascinating digest of where and how we live.
All listings for this product


Be the first to write a review