Picture 1 of 1
Stock photo

Picture 1 of 1
Stock photo

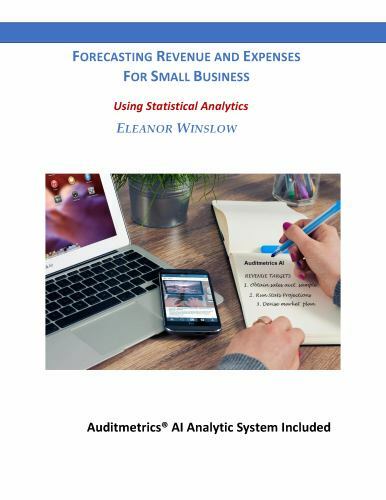
Forecasting Revenue and Expenses for Small Business : Applying Statistical Analytics by Auditmetrics (2020, Trade Paperback)

OnTimeBooks (53552)
98.6% positive feedback
Price:
$8.60
Free shipping
Returns:
Condition:
Condition Notes: Gently read. Binding tight; spine straight and smooth, with no creasing; covers clean and crisp. Minimal signs of handling or shelving.
- Buy It NowForecasting Revenue and Expenses for Small Business: Using Statistical Analy...
Oops! Looks like we're having trouble connecting to our server.
Refresh your browser window to try again.
About this product
Product Identifiers
PublisherAuditmetrics
ISBN-100578797259
ISBN-139780578797250
eBay Product ID (ePID)16050071228
Product Key Features
SubjectGeneral
Publication Year2020
LanguageEnglish
Publication NameForecasting Revenue and Expenses for Small Business : Applying Statistical Analytics
TypeTextbook
AuthorAuditmetrics
Subject AreaMathematics, Business & Economics
FormatTrade Paperback
Additional Product Features
Intended AudienceCollege Audience
SynopsisThis book is #2 in the Small Business Power Book Series. It includes a small business version of Auditmetrics AI V6.5 that advances analytics for small businesses. All three books are guides in learning the analytics of the Auditmetrics AI business system. The included software has file size and feature limitations. It will be fine for small businesses with 10 employees or less. For larger businesses, the full features of Auditmetrics AI Professional would be required with its ability to sample up to millions of account records. All books and software are ideally suited for small businesses that operate on desktop and laptop computers. They assist in competing in an evolving technology driven business environment that favors analytics. Our economy is on a high tech commercial revolution where huge business entities marshal vast sophisticated programming to correct past deficiencies and search for potential opportunities. Auditmetrics helps the smaller enterprise survive by providing a level analytical playing field. It is designed as a complete resource for business analytic methods and technology. To get an overview of the operation of the AI Assistance System and Small Business Power Book Series, select the trailer link below: https: //auditmetrics.com/app_data/trailer2.mp4 For help with Book/Software set up: support@auditmetrics.com The use of statistical analytics in forecasting cashflow can involve complex procedures that may be beyond the experience of many small business managers. With the software's use of AI assistance, the manager needs only to decide on a few key targeted statistical inputs and this book guide the user from initial plan to completed product. Auditmetrics AI was originally developed for auditors to quickly get up to speed with Computer Assisted Audit Techniques (CAATs) system that is being pushed by government agencies and large corporations. Auditmetrics algorithms conforms to both AICPA and IRS statistical standards. Auditmetrics has recently expanded data input potential by adding an ability to input data from standard reports that many accounting management systems such as QuickBooks offer. It then can provide a complete analytical framework from auditing cashflow to forecasting revenue and expenses. All of this is done in a user friendly environment such that one can traverse the complexity of the statistical audit by using a simple three step process. This book guides the business manager through the process from original statistical sample to developing datasets for statistical forecasting techniques using such powerful tools as regression and correlation. There is no need for any additional statistical software. All analytic techniques are available through MS Excel's Analysis ToolPak, an add-in feature that provides data analysis tools for financial and statistical data analysis. "Forecasting Revenue and Expenses for Small Business" PART I - The Statistical Method In this section is covered the statistical principles of analyzing empirically derived account data that is the underpinning of economic analysis. The fundamental idea covered is the uncertainty and variation of data used to help explore and understand the dynamics of the business fiscal environment. PART II - Forecasting Revenue and Expenses using Multivariate Techniques. This Section is the discussion of two powerful tools for forecasting future economic activity, linear regression and correlation. The building and interpretation of regression model outputs is accomplished by using MS Excel built-in functions, Market analysis and operations research discussions can involve very complex procedures that may be beyond the reach of small business managers. With this book the complexity of properly sampling, conducting statistical analysis and documenting accounts is handled by Auditmetrics AI assisted software that is made available with the book. It prepares the business manager to conduct sophisticated analysis that is inexpensive and easy to use. The AI assistance starts with the manager to first decide on a margin of error and the software then guides the process through to the finish.PART I - The Statistical Method - In this section is covered the statistical principles of analyzing empirically derived account data that is the underpinning of economic analysis. Two fundamental ideas are uncertainty and variation. Data is used to help explore and understand the dynamics of the business environment. What leads to that uncertainty is data variation that is inherent in financial data. In this section is covered the basic measurement of central tendency, variation and uncertainty such as the mean, standard deviation and probability. It is presented at a basic level for those who have minimal experience in statistics. For those who have taken courses in statistics, this will be a refresher that focuses on statistical methods used in economic analysis and market research.Part II - Forecasting Revenue and Expenses Using Regression - In this Section is a discussion of using one of the most powerful tools in forecasting future economic activity. It begins by covering the core principles of regression, starting with bivariate modeling and progressing to multiple and non-linear regression. The building and interpreting of regression output is accomplished by using MS Excel built-in functions. Though Excel can do all the regression calculations and outputs covered in this section, it is still important to review the underlying mechanics that is provided in Part I.
All listings for this product


Be the first to write a review


